Version History
Here you can find the changelog of Trading Lab since it was posted on our website on 2023-06-20.
The latest version is 1.69 and it was updated on soft112.com on 26 April, 2024.
See below the changes in each version:
version 1.69
posted on 2024-04-20
Apr 20, 2024
Version 1.69
1. Historical data is updated to 2024-04-20.
2. Improve performance and stability.
version 1.68
posted on 2024-04-13
Apr 13, 2024
Version 1.68
1. Historical data is updated to 2024-04-12.
2. Improve performance and stability.
version 1.65
posted on 2024-03-24
Mar 24, 2024
Version 1.65
1. Historical data is updated to 2024-03-23.
2. Improve performance and stability.
version 1.59
posted on 2024-02-16
Feb 16, 2024
Version 1.59
1. Fix the bug of distortion in China futures market playback
2. Improve performance and stability
version 1.57
posted on 2024-02-08
Feb 8, 2024
Version 1.57
Improve performance and stability
version 1.56
posted on 2024-02-07
Feb 7, 2024
Version 1.56
1. Added new varieties of China Futures Exchange
2. Improve performance and stability
version 1.54
posted on 2024-01-23
Jan 23, 2024
Version 1.54
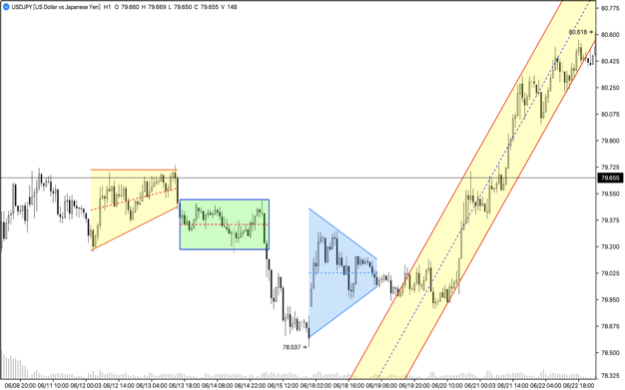
1. Add channel type drawing component
2. Add parallel channel
3. Add flat top / bottom
4. Add disjoint channel
5. Implement cross-variety and cross-period display of drawing components
version 1.52
posted on 2024-01-16
Jan 16, 2024
Version 1.52
1. Add arrow drawing component
2. Improve stability and fix several crash issues
3. Local historical data updated to 2024-01-15
version 1.49
posted on 2024-01-09
Jan 9, 2024
Version 1.49
1. Add drawing functions, provide line charts and shapes, and other types of drawing components will be gradually launched in the future.
1) Click to show/hide the drawing toolbar to open it
2) Long press to select other related components in the same group
3) Supports magnetic suction mode, making it easier to select key prices in magnetic suction mode
4) Continuous drawing mode, after selecting a drawing component, can continuously draw without interruption
5) Supports locking, hiding, and deleting
6) Support storing component styles as templates for easy switching between different styles.
7) Provide a floating toolbar for editing components, allowing for quick modification of their appearance.
8) More features, including cross cycle display and persistence, will be provided gradually in the future
2. Optimize the experience and improve stability
3. Historical data updated to 2014-01-05
version 1.48
posted on 2024-01-01
Jan 1, 2024
Version 1.48
1. Add TrackPad gestures to the chart: slide two fingers horizontally to move the K line, slide two fingers vertically to zoom the K line, and the two-finger zoom operation also zooms the K line.
2. Change the historical data model structure and improve chart performance. When opening the window chart in version 1.48, the import historical data window will pop up to upgrade the data.
3. The historical data time is updated to 2023-12-29.
4. Modify the bug that the color selector layout is disordered.
version 1.47
posted on 2023-12-25
Dec 25, 2023
Version 1.47
1. Improve user experience.
2. Historical data updated to December 22, 2023.
version 1.45
posted on 2023-12-16
Dec 16, 2023
Version 1.45
1. Improve user experience.
2. Historical data updated to December 15, 2023.
version 1.44
posted on 2023-12-11
Dec 11, 2023
Version 1.44
1. Fixed a bug that caused parameters to be synchronized to similar indicators when editing indicators.
2. Historical data is updated to 2023-12-08.
3. Modify several user experience issues.
version 1.43
posted on 2023-12-04
Dec 4, 2023
Version 1.43
1.Improve performance and stability
2.Historical data updated to 2023-12-01
3.Fixed the bug of incomplete display of charts on the extended screen
version 1.40
posted on 2023-11-16
Nov 16, 2023
Version 1.40
1. Improve performance and user experience
2. Update local historical data to 2023-11-16
version 1.39
posted on 2023-11-04
Nov 4, 2023
Version 1.39
1. Improve performance and user experience
2. Update local historical data to 2023-11-03
version 1.38
posted on 2023-10-29
Oct 29, 2023
Version 1.38
1. Improve performance and stability
2. Historical data updated to 2023-10-27
version 1.37
posted on 2023-10-22
Oct 22, 2023
Version 1.37
1. One-click trading panel adds trading lot calculation menu
Add two trading lot calculation strategies
1) Calculate the number of trading lots based on the usage ratio of available margin
Number of lots = available margin * available margin usage ratio / margin occupied per lot
2) Calculate the number of trading lots based on the total position of the variety and the selected position multiplier.
Number of lots = total position of the current variety * selected multiplier
2. When adding a new indicator to the indicator window, the first indicator or the previous indicator can be used as the data source for calculation.
A typical application scenario is to generate moving averages based on RSI data in an RSI indicator window.
1) Add a new moving average indicator A, select "First Indicator's Data" in the "Apply to" option, and the moving average indicator A will be calculated based on the value of RSI.
2) Add another moving average indicator B, select "Previous Indicator's Data" for the "Apply to" option, and the moving average indicator B will be calculated based on the value of the moving average indicator A.
3. The data center adds individual stocks and index varieties of the stock market
1) Index varieties increase important indexes in the A-share market and other international markets
2) The stock varieties include star stocks from US stocks, Japanese stocks, German stocks, A-shares and other markets.
Since there are many stocks and indices, they will be added in batches later. Users who need varieties please contact the customer service email address and priority can be arranged.
4. Fixed the bug that the styles were not fully synchronized after modifying the styles.
5. A new indicator Six Meridians Divine Sword has been added to the advanced indicators.
The purpose of the indicator is trend tracking and trend identification. For specific usage methods, please refer to the demonstration in the user manual.
6. Fixed several issues that caused the App to crash and improved performance.
7. The client’s historical data is updated to the latest.
version 1.36
posted on 2023-10-05
Oct 5, 2023
Version 1.36
1.Performance and user experience improvements
2.Historical data updated to September 29th, 2023
version 1.35
posted on 2023-09-23
Sep 23, 2023
Version 1.35
1. The calculation and adjustment of margin and profit for Chinese futures are consistent with the exchange
2. Newly added weighted index varieties for Chinese futures
3. Update local historical data to September 22, 2023
version 1.34
posted on 2023-09-19
Sep 19, 2023
Version 1.34
1. The calculation and adjustment of margin and profit for Chinese futures are consistent with the exchange
2. Fix the bug where the K-line graph remains unchanged when replaying the market on Chinese futures cycles such as weeks, months, and years
3. Update local historical data to September 19, 2023
version 1.31
posted on 2023-09-03
Sep 3, 2023
Version 1.31
1. Performance optimization, fixing several bugs, and improving stability
2. Historical data updated to September 1st, 2023
version 1.30
posted on 2023-08-11
Aug 11, 2023
Version 1.30
1. Add Trading Lab user manual
2. Improve user experience and performance
3. Update historical data to 2023-08-10
version 1.29
posted on 2023-06-30
Jun 30, 2023
Version 1.29
1. Add a menu item function: select the K line and pop up the right-click menu to jump to the selected date
2. Historical data updated to 2023-06-29
3. Add Trading History Review window
The Trading History Review window is a powerful tool that can help you review and analyze trading history data. Through this window, you can load transaction history data from multiple sources, including transaction history of in-app simulation accounts, transaction history data exported from MT4/MT5 (HTML format), and historical records exported from MT4/MT5 signals (CSV format, downloaded from the MQL5 official website).
Using this window, you can perform a review of the transaction history, that is, replay and observe the occurrence of the transaction. You can double-click a specific transaction to quickly switch to the current point in time of the transaction, and the corresponding transaction mark will be displayed on the chart. This allows you to visually observe important details such as the timing of trade execution, price movement and trade results.
The Trading History Review window provides you with a quick way to deeply analyze and evaluate your trading strategies. You can use a variety of tools and indicators to further research and verify the performance of your trades. By looking closely at historical trading data, you can identify patterns, identify successes and failures, and gain valuable lessons from them.
In summary, the Trade History Review window is a powerful and flexible tool that allows you to load and analyze trade history data from multiple sources, and conduct trade reviews in an interactive manner. It helps you better understand and improve your trading strategies, providing valuable insights and learning opportunities to improve your trading success and effectiveness.
Main features of transaction history review:
1. Support optional display of some columns
2. Support setting to display only the current selection or all history on the chart
3. Support setting to display on the chart until the opening time or closing time
4. Support mouse double-click operation to display current transaction records on the chart
version 1.28
posted on 2023-06-18
Jun 18, 2023
Version 1.28
1. Drag the position price line to set take profit and stop loss
2. Improve chart performance and stability
3. Update historical data to 2023-06-16